TLDR
We'll look at the WebKit JIT compiler - the part that converts JavaScript bytecode to machine code.
Series
- 0x00: New Series: Getting Into Browser Exploitation
- 0x01: Setup and Debug JavaScriptCore / WebKit
- 0x02: The Butterfly of JSObject
- 0x03: Just-in-time Compiler in JavaScriptCore
- 0x04: WebKit RegExp Exploit addrof() walk-through
- 0x05: The fakeobj() Primitive: Turning an Address Leak into a Memory Corruption
- 0x06: Revisiting JavaScriptCore Internals: boxed vs. unboxed
- 0x07: Preparing for Stage 2 of a WebKit Exploit
- 0x08: Arbitrary Read and Write in WebKit Exploit
Introduction
In the last post we explored how the JavaScriptCore, the JavaScript Engine from WebKit, stores objects and values in memory. In this post, we'll explore the JIT, the Just-In-Time compiler.
The Just-In-Time compiler
Just-In-Time compiler is a complex topic. But simply speaking, the JIT compiler compiles the JavaScript bytecode, which is executed by the JavaScript virtual machine, into native machine code (assembly). The process is similar to what you see when you compile C code, but there's some fanciness when it comes to the JIT in JavaScriptCore.

To learn more about the JIT, I asked Linus for some tips, and he told me to check out some official WebKit resources like the article JavaScriptCore CSI: A Crash Site Investigation Story. The article has some useful insights on how WebKit engineers debug a crash and diagnose a bug to find the root cause, which is precisely what we would want to do, if we were to find some security issues in JavaScriptCore. One of the many things the blog describes is, how to create an address sanitizer build of WebKit to catch possible heap overflows or use-after-free issues.
$ cd webkitDIr
$ ./Tools/Scripts/set-webkit-configuration --asan
$ ./Tools/Scripts/build-webkit --debug
This is cool but we are more interested in the "JIT stuff", so let's find something that could be useful for our research. Further into the article, we can find the following details about the JIT compilers.
JSC comes with multiple tiers of execution engines.
There are 4 tiers:
- tier: the LLInt interpreter
- tier: the Baseline JIT compiler
- tier: the DFG JIT
- tier: the FTL JIT
tier 1: the LLInt interpreter
This is the regular JavaScript interpreter, which is the basic JavaScript Virtual Machine. To understand a bit more about this, let's jump into the source code. If we have a quick look into the LowLevelInterpreter.cpp source file, we can see the main interpreter loop, which simply loops over the provided JavaScript bytecode and then executes each instruction.
//===================================================================================
// The llint C++ interpreter loop:
// LowLevelInteroreter.cpp

JSValue Cloop::execute(OpcodeID entry OpcodeID, void* executableAddress,
VM* vm, ProtoCallFrame* protoCallFrame, bool isInitializationPass)
{
    // Loop Javascript bytecode and execute each instruction
    // [...] snip
}
tier 2: the Baseline JIT compiler
When there's a function which is called a lot, it becomes "hot". This is a term used to describe that it's executing a lot and the JavaScriptCore might decide to JIT the function. We can get some additional information if we look into JIT.cpp source file.
void JIT::privateCompileMainPass()
{
    ...
    // When the LLInt determines it wants to do OSR entry into the baseline JIT in a loop,
    // it will pass in the bytecode offset it was executing at when it kicked off our
    // compilation. We only need to compile code for anything reachable from that bytecode
    // offset.
    ...
}
On Stack Replacement (OSR) is a technique for switching between different implementations of the same function. For example OSR would be done to switch from interpreted ( unoptimized code) on-the-fly to the JIT compiled code during execution. More on OSR here.
However at this stage the machine code is still very compatible (not sure if that's a good term to describe) to the original bytecode and there hasn't been really optimized yet.
tier 3: the DFG JIT
From another article Introducing the WebKit FTL JIT we can learn
The first execution of any function always starts in the interpreter tier. As soon as any statement in the function executes more than 100 times, or the function is called more than 6 times (whichever comes first), execution is diverted into code compiled by the Baseline JIT. This eliminates some of the interpreter’s overhead but lacks any serious compiler optimizations. Once any statement executes more than 1000 times in Baseline code, or the Baseline function is invoked more than 66 times, we divert execution again, to the DFG JIT.
Here, the DFG stands for Data Flow Graph. The article also has some great picture illustrating the DFG pipelines.

Reading more it says, the DFG starts by converting bytecode into the DFG CPS form.
CPS stands for Continuation-Passing Style, which means your code doesn't use return statements but instead it continues and passes onto the next function. I think you can think of this like the next() function in the express framework, at least that's how I imagine it:
app.use('/hello', function (req, res, next) {
  console.log('Hello, World!')
  next() // continues execution by calling next() instead if returning.
})
Moving on with the article
the DFG starts by converting bytecode into the DFG CPS form, which reveals data flow relationships between variables and temporaries. Then profiling information is used to infer guesses about types, and those guesses are used to insert a minimal set of type checks. Traditional compiler optimizations follow. The compiler finishes by generating machine code directly from the DFG CPS form.
As you can see, things start to get interesting. The JIT compiler guesses types, and if the JIT believes types don't change, the JIT can remove certain checks. Which of course can speed up the code dramatically if a function is called a lot.
tier 4: the FTL (Faster Than Light) JIT
When this tier was introduced, it used the known compiler backend LLVM, to apply much more typical compiler optimizations.
The FTL JIT is designed to bring aggressive C-like optimizations to JavaScript.
At some point, LLVM got replaced by the B3 backend, but the idea is the same. So here the JIT compiler might make more assumptions on the code for the sake of optimization.
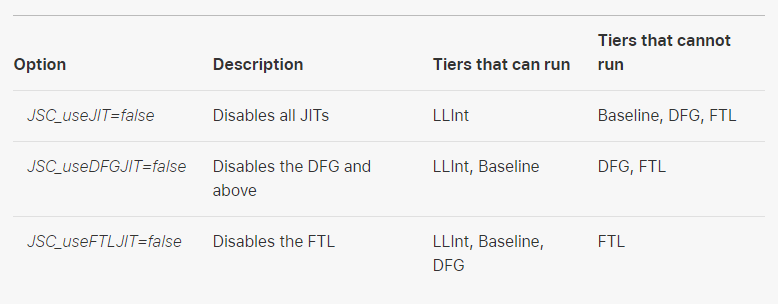
But let’s look at this a bit more practically. This is where the article on the crash investigation comes into play. It introduces several environment variables that can be used to control the behavior of the JIT and enable debugging output. For some options, see below.

There are additional environment options listed in the post like JSC_reportCompileTimes=true which reports all JIT compile times.
We can also set this in lldb, to dump disassembly of all JIT-compiled functions.
(lldb) env JSC_dumpDisassembly=true
(lldb) r
There is a running process, kill it and restart?: [Y/n] Y
...
Genereated JIT code for Specialized thunk for charAt:
    Code at [0x59920a601380, 0x59920a601440]
        0x59920a601380: push %rbp
...
We already see some JIT optimization debug prints. And looking at the function names that were JIT-ed, it looks like functions like charAt(), abs() and others have been already optimized. However, we want our own function to be optimized, so let's create a function called liveoverflow which simply loops n times provided as the function argument and returns the sum of n numbers.
function liveoverflow(n) {
    let result = 0;
    for(var i=0; i<=n; i++) {
        result += n;
    }
    return result;
}
Now we need to make the function "hot"; we can do this by calling the function many times, which tells the JIT that this function is in demand and it needs to be JIT-ed. So let's start calling it 4 times.
>>> for(var j=0; j<4; j++) {
    liveoverflow(j);
}
We do get some output, but nothing related to JIT-ing our function, which means it's still not "hot", so let's increase the number of function calls to 10.
>>> for(var j=0; j<10; j++) {
    liveoverflow(j);
}
90
>>> // nothing yet
>>> for(var j=0; j<10; j++) {
    liveoverflow(j);
}
90
>>> // nothing yet, let's call it again
>>> for(var j=0; j<10; j++) {
    liveoverflow(j);
}
90
>>> Generated JIT code for fixup arity:
    Code at [0x59920a601880, 0x59920a601900]
    ...
    //Baseline JIT
    ...
    Optimized liveoverflow#...
There it is! Calling it multiple times gave us the Baseline JIT. Now let's try to trigger an even more aggressive JIT.
>>> for(var j=0; j<100; j++) {
    liveoverflow(j);
}
Generated Baseline JIT code for liveoverflow#...
...
//optimized function code in assembly
...
This is fun looking at JSC kicking in different JITs based on the optimization needed. Now let's get crazy and try 100,000 calls.
>>> for(var j=0; j<100000; j++) {
    liveoverflow(j);
}
Optimized liveoverflow#...using FLTMode with FTL ... with B3 generated code ...
...
FTL JIT, BOOM!
There's soo much more output which we are not going to look into because honestly, I don't understand that myself. However, the critical part is that we have learned about various debugging methods and tricks to dig deeper.
An Attack Idea
Now that we know a bit about JIT, and from the last post we know about JavaScript objects, consider the following idea.
If the JIT compiler guesses and assumes types in the code, and removes checks, like for example simply moves from a specified memory offset, could that be abused?
Just hypothetically, let's say some JIT-ed code expects a JavaScript array with doubles and directly acts on these values. The JIT compiler then optimizes all checks away... But then you find a way to replace one entry of the array with an object. Now an object would be placed as a pointer into that array. So if the JIT-ed code has no checks and returns the first entry of this array, it would return that pointer as a double - and that would be pretty bad. This leads to a type confusion bug, and actually it's one of the typical browser vulnerability patterns found in the wild.
There's one more thing we need to talk about. How does the JIT prevent things like this from happening? Well it turns out that the developers try to model every function that can cause an effect on the assumptions made by the JIT compiler. So if there is anything that could change the layout of the array, for example when an object is placed into an array that expects only doubles as it's type, then such a function will be marked "dangerous".
Let me quote a sentence from this ZDI blog post about "Inverting your assumptions: a guide to JIT":
The way to state that an operation is potentially dangerous to prevent later optimizations is to call a function called clobberWorld which, among other things, will break all assumptions about the types of all Arrays within the graph
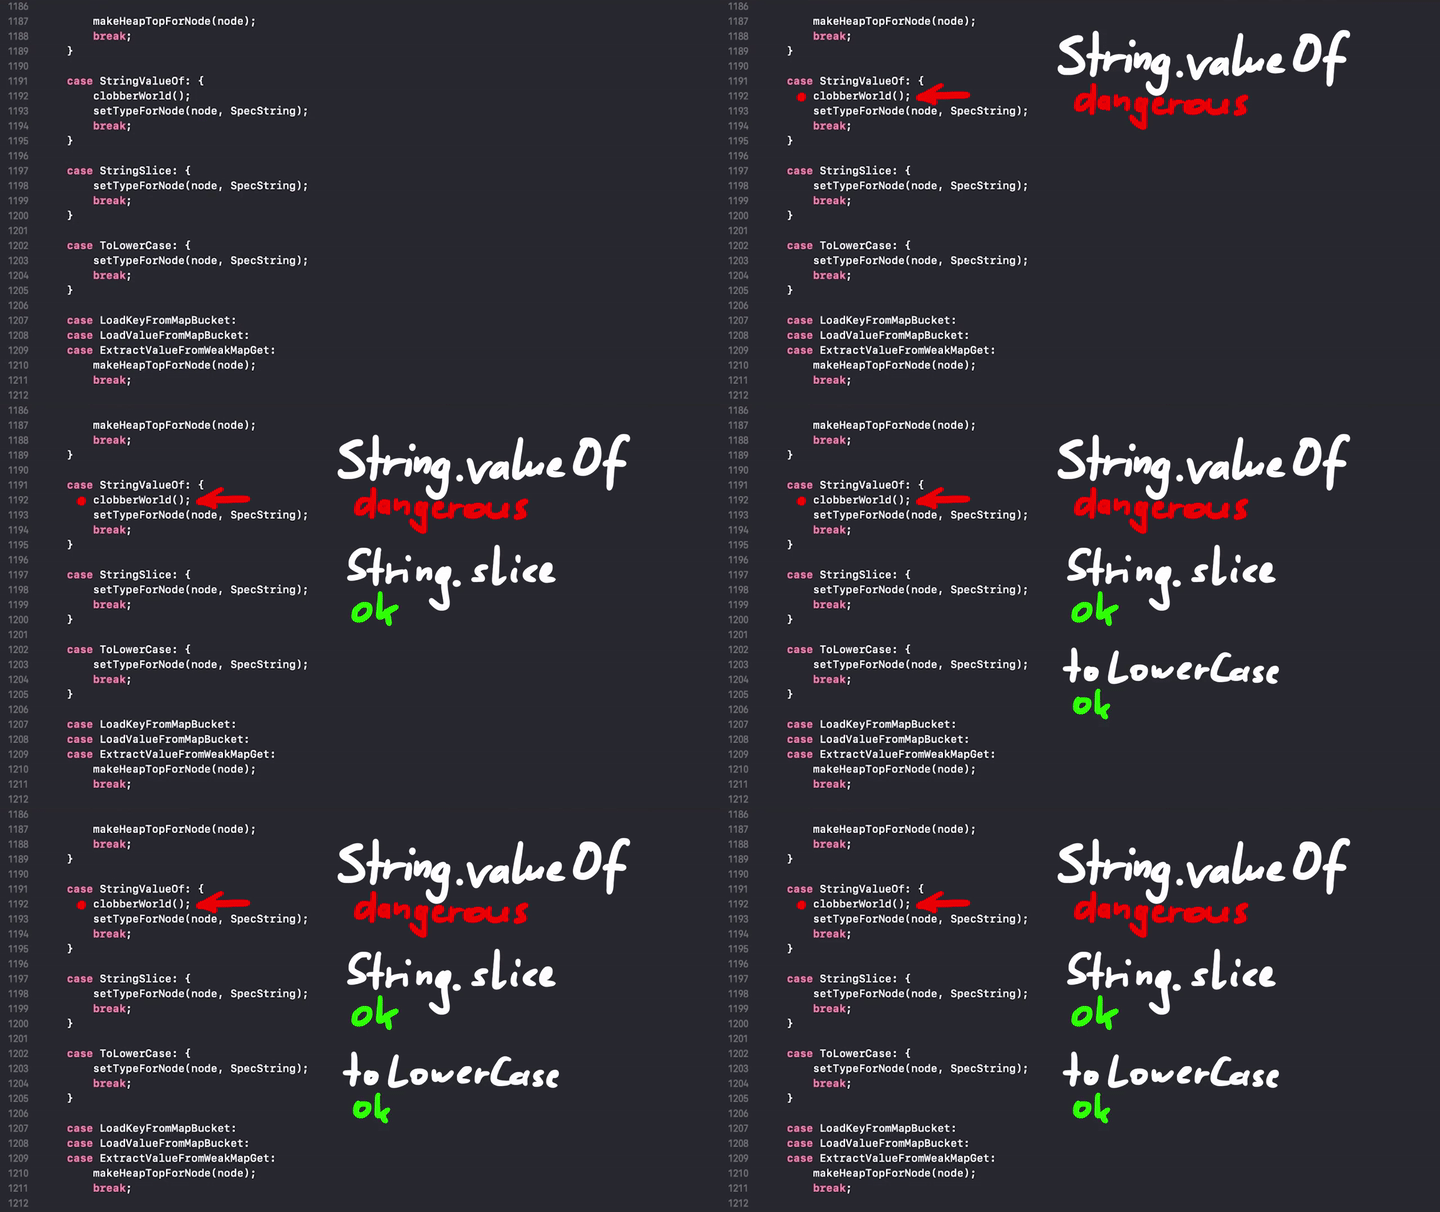
The JavaScript engine tries to break the assumptions which were made prior to the side effect. So the engine marks everything that might affect the data as dangerous, and it's done by calling the clobberWorld() function. For example String.valueOf() appears to be dangerous:

And here is the clobberWorld() snippet.
// JavascriptCore/dfg/DFGAbstractInterpreterInlines.h
template <typename AbstractStateType>
void AbstractInterpreter<AbstractStateType>::clobberWorld()
{
    clobberStructures();
}
clobberWorld() calls clobberStructures(), which is defined in the same file.
// JavascriptCore/dfg/DFGAbstractInterpreterInlines.h
template <typename AbstractStateType>
void AbstractInterpreter<AbstractStateType>::clobberStructures()
{
    m_state.clobberStructures();
    m_state.mergeClobberState(AbstractInterpreterClobberState::ClobberedStructures);
    m_state.setStructureClobberState(StructuresAreClobbered);
}
So side effects that the JIT has to be very careful about are things like changing the structure of an object. For example, let's say that the JIT optimized accessing a property obj.x on an object, and suddenly you delete the property, now it has to be marked that the structure has changed so that JIT-ed code can be discarded; otherwise, there might be situations leading to memory corruptions.
But that's all for now. In the next post, we'll look at Linus's exploit, which abuses such a case.

