TL;DR
Guest video by OALabs about unpacking a self-injection malware.
Introduction
OALabs is an excellent YouTube channel with videos on Reverse Engineering and Malware Analysis. Since I don't really cover Malware Analysis, I thought this would be great to do a small collaboration. I'm super excited to present you a video and blog post on Unpacking a basic malware where we'll swift through the topics such as Typical Malware Packing Techniques, some Windows Internals and even step on the tools such as x64dbg, IDA and PE-Bear. So let's jump into it!
The blog post will generally try to cover the process, but the video will show much more detailed steps how to follow along.
Peek at Packers
Malware often incorporates the idea of packing themselves into a more obfuscated executable to hide themselves from antivirus or generally make analysis more cumbersome. And in this post, we'll be mostly looking at one specific kind of unpacking technique that you can use to defeat a malware trick called Self-Injection.
What is Self-Injection?
Self-Injection is a way to have most of the malware code encrypted, but later during the execution, the malware decrypts the malicious code in-memory and then transfer the execution to the newly unpacked malicious code.
Self-Injection is just one of the techniques used by malware authors for obfuscation, there are many other techniques like Process Injection (or Process Hollowing), Classic DLL Injection and Thread Execution Hijacking. There are a few different techniques for Self-Injection itself, but a common technique is to first unpack a small stub in-memory, it transfers the execution to the stub, the stub code then changes the permission of a section in the process, write the malicious code into those sections and transfer the execution back to the overwritten sections of the PE file.
This is also often called PE Overwrite. A famous packer that also uses this technique is UPX. But in today's post, we'll look at a different example that is also a bit more advanced - but the principles are similar.
The malware we look at today will actually go through 2 stages of obfuscation,
- The PE Overwrite technique
- Followed by a DLL Injection
Redaman
The malware is called Redaman and the sample is coming from the excellent Malware Traffic Analysis blog. The cool thing about this sample is, that it only uses the Self-Injection technique, but has two stages and has only a single process. So it's an ideal training sample.
Before we head into the reverse engineering part, we can also run the malware in a sandbox. The interesting observation here is, that the malware doesn't spawn many processes, which is an indication for Self-Injection techniques. Having this assumption we can look for this specifically.
Stage One - The Stub
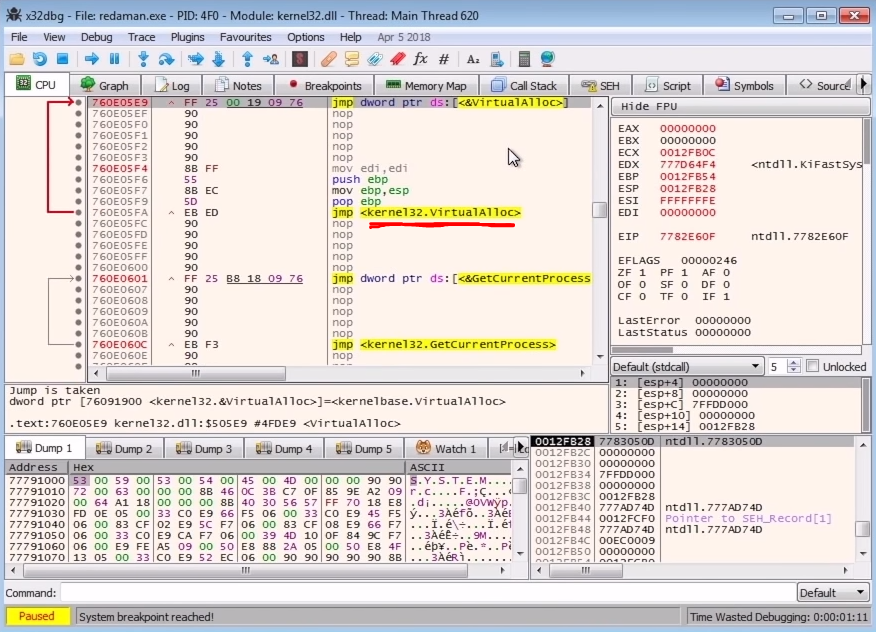
We'll be analyzing the unpacking in a Windows VM with some tools like PE-Bear, IDA and x64dbg. Since the unpacking happens in-memory, we need to first look at the memory allocation and we'll fire-up the x64dbg to place some breakpoints to see how the malware allocates the memory for unpacking. First off, we'll start by breaking at the return of the VirtualAlloc call, and the reason for this is that the return value from this function call will be the address of the newly allocated memory and the return value is placed in the register eax. If we search for the function name VirtualAlloc, you'll see that it's just a wrapper around the main kernalbase.VirtualAllocEx API which is inside kernelbase.dll, so we need to jump till we hit this real virtual allocation API and then place our breakpoint (F2).
VirtualAllocNow the second thing we need to do is to place a breakpoint at the VirtualProtect because when the malware needs to write to their own process when performing the Self-injection technique, it needs to change the protections to get the permission to write, so adding a breakpoint here is a great idea. This is the same for the PE overwrites, if the process is overwriting a section, then it definitely needs the permissions to do so because it won't be write permissive by default. This is also a trigger to the Anti-Virus programs anytime you see the write access permissions on a PE section.
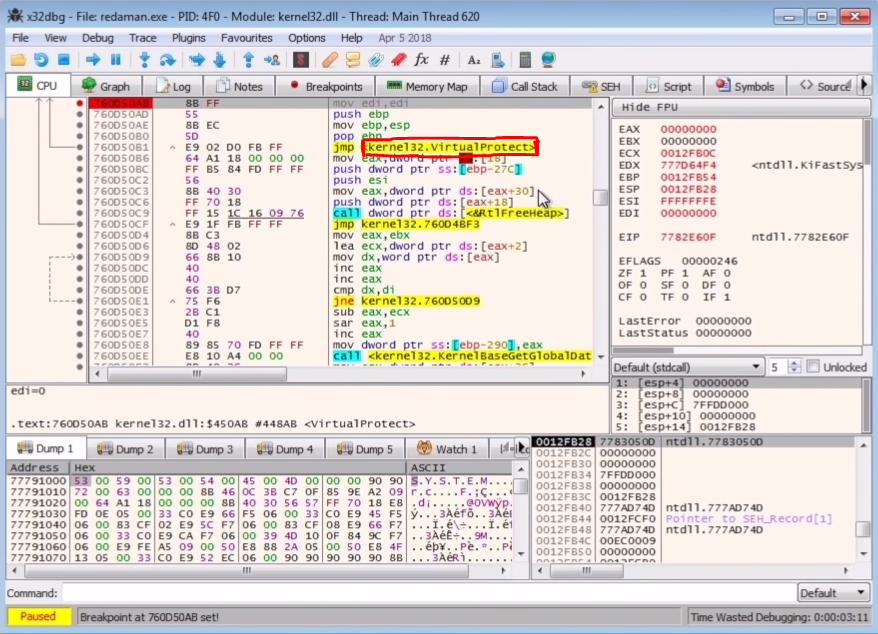
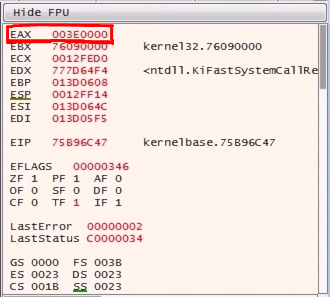
VirtualProtectTo place a breakpoint at the VirtualProtect, we'll search for the function name and place the breakpoint at the entry point because we need to see what's being passed to it as the argument. Now when we run the program we'll hit the first breakpoint at the entry point which is automatically placed by the x64bdg, so we continue to run the code till we hit our breakpoints. Stepping through we hit our VirtualAlloc breakpoint right at the return of the call and in the eax register we see the address which points to the newly allocated memory.
If you follow the newly allocated memory in dump and continue the execution of the code, we'll see some stuff written to the newly allocated area of memory. Now, this could be some executable code, maybe a stub, which will be used to unpack the real malware code.
And if we follow this in the Memory map, we'll see that the protections are ERW which stands for Executable, Readable and Writable which means the code execution flow may be transferred here which is again, just as we expected.
Continuing the execution flow, we hit another breakpoint to VirtualAlloc, which means there was a second memory section which needs to be allocated. If we follow the dump and continue, we hit the VirtualProtect breakpoint, and in the dump, we see the PE file in memory. So anytime we see a PE file in the dump, it's probably a good idea to dump the contents to a file. We can dump the memory region to the file from the Memory Map.
Now that we have another PE file let's fire-up PE-Bear to look at it. After loading the dumped file into PE-Bear and looking at the section headers, we see that it's a legitimate executable.
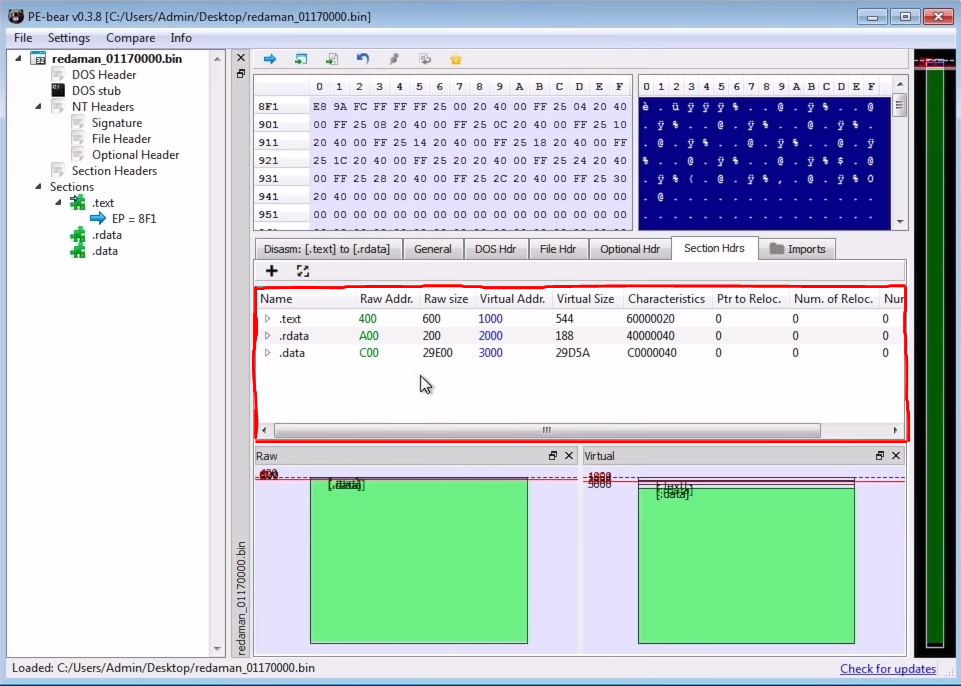
We say "legit" because there are 2 types of dumped files. One type is ready to be executed in its unmapped format like any regular executable file, the other type is the mapped format which you get when it was already loaded into memory. In our case, it's ready to be executed, and we don't need to change the values in the section table to make it into a mapped executable.
Coming back to the x64dbg or x32dbg, we've currently paused the execution at the VirtualProtect breakpoint and looking at the stack, we see that the memory address which the protections need to be changed is pointing the executable itself -redaman.exe which looks like the malware is doing a PE Overwrite. Another interesting thing is that if we go to the return of the VirtualProtect and step one instruction, we see that the address is pointing to the first virtually allocated memory. So basically, the executable allocated this memory region to place a loader stub to unpack the payload and then it tries to change the protections of the PE file to overwrite it. We don't need to walk through the overwriting instructions because we've already dumped the payload to the disk.
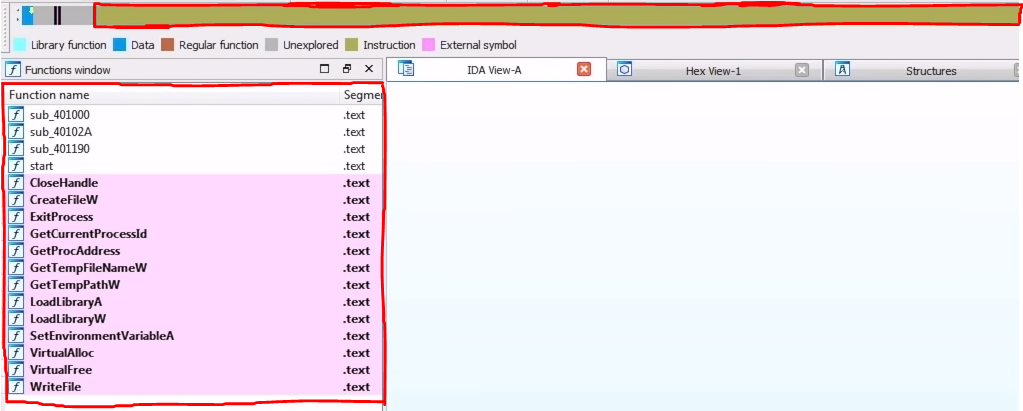
Now it's time for us to open the dumped PE file in IDA Pro. Immediately we can see it's another packed file due to following reasons
- There is a lot of un-analyzed code in the "Overview Navigator".
- There are hardly any functions in the "Function Window".
- There are hardly any imports in the "Imports Table".
To know how it's packed, we can go to the beginning of the data section blob, and follow the cross-references of this data so that we can find the places where the code uses this blob of data. Sometimes following them leads us straight to the unpacking logic. In our case, we land right in the face of it, and it was just an XOR + Rotate-Left loop to get the unpacked malware.
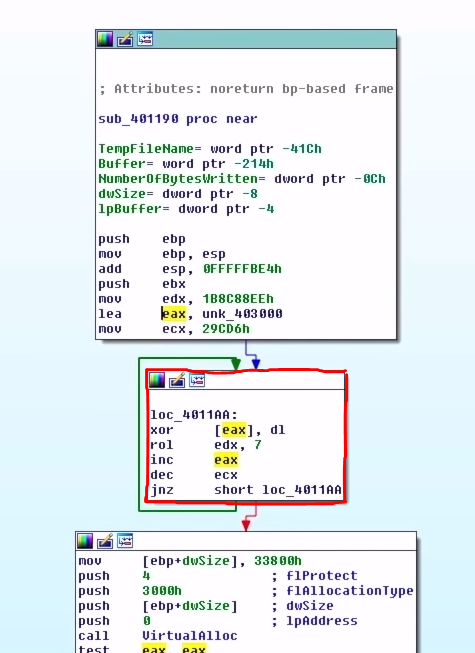
Looking at the disassembly, we can figure out what register plays what role, for example, the register ecx is decremented in the block which is probably the length of the encrypted blob, which is actually a common pattern you see when looping is involved. There's also edx which looks like it's the key used to decrypt the packed code by Rotate-Left preceding the XOR operation. Basically, it's a very simple encryption.
Glancing a bit more at the malware's execution flow, we see that it allocates some memory and creates a string byte-by-byte on the stack.
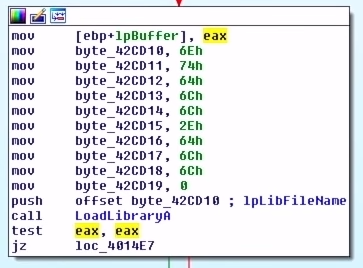
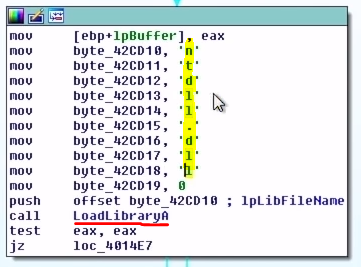
ntdll.dll Stack StringA quick IDA tip - you can select the hex and press "R" to convert them into characters by the ASCII value. Doing this on each byte of the stack string gives us "ntdll.dll". Right after the string is built, there's a call to LoadLibraryA which is used to load a, and this makes sense because the malware is generating the name of the DLL byte-by-byte and then using LoadLibraryA to load the DLL to access its functions.
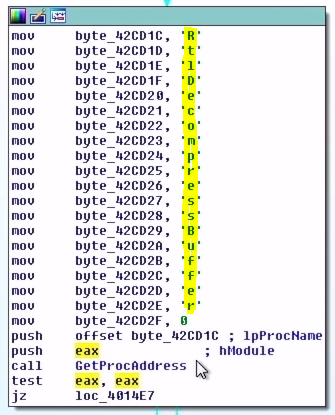
LoadLibraryARight below the call to LoadLibraryA, we see another set of bytes used to build a string and the string is "RtlDecompressBuffer" which is passed to GetProcAddress. This function will return the procedure's address. In our case the malware is trying to resolve the address of the function RtlDecompressBuffer after loading the ntdll.dll.
RtlDecompressBufferThe RtlDecompressBuffer is used to decompress the compressed data (similar to unzip in some way). Now after grabbing the address for the RtlDecompressBuffer, it basically calls it by passing our decrypted blob and other things such as the type of compression algorithm, the buffer that contains the decompressed data, the decompressed data size, and others. The result of this call will give us the unpacked malware.
After decompressing the decrypted data, the malware creates a temporary file path using GetTempFileNameW, creates the file using CreateFileW, finally write to the file using WriteFile and load the file as a DLL using LoadLibraryA
Additionally, the malware after loading the file as a DLL, it again creates a string byte-by-byte, uses GetProcAddress to resolve the address to the function and calls it by passing another string which is again, you guessed it, built byte-by-byte. But this doesn't really tell us much unless we analyze the malware itself which we are not going to cover in this post.
The idea of writing the decrypted and decompressed data to the disk is pretty arcade in modern-day malware, but it's interesting to look at how packers worked back then. Now let's get our hands on the file which was written to the disk and loaded as the DLL later.
To get our hands on the DLL file, we've got two ways
- Write a script to decrypt, decompress and extract the DLL.
- Simply find the path to the DLL file once it's written to the disk.
Well, as you can see the second option is a lot simpler so we'll do that, but I do encourage you guys to write a script to do all the things for you because you can learn a lot more by writing some code for situations like this.
Now to get the file's path, we need to place a breakpoint at LoadLibraryA because once the DLL is written to the disk, the malware will try to load it back to the process and to do that it requires the path, and we can catch that in our debugger.
We first run the malware from the debugger which will break automatically at the entry point. We do this because if we place a breakpoint at LoadLibraryA before the executable is fully initialised, we'll hit many breakpoints which we are not interested in. We will place out breakpoint on LoadLibraryW because there are two versions of the Windows API call which takes a string as an argument and any Windows API which takes a string as it's argument has an A (like LoadLibraryA) and a W (like LoadLibraryW). 'A' stands for ASCII and 'W' stands for byte string and the 'A' calls are just the wrappers around the 'W' ones so placing the breakpoint at the LoadLibraryW will hit all the load DLL calls.
Continuing our execution, we immediately hit our breakpoint for LoadLibraryW and in the eax register we have the address to the path string which is in our case "C:\\Users\\Admin\\AppData\\Local\\Temp\\EE54.tmp". Browsing to the file location with the file explorer could be a bit surprising. We end up in the right place, but we don't see the file. This is due to the hidden attribute set to the file, and we can disable that by using the attrib command.
# h => hidden
# s => system

# To hide
attrib +s +h filename

# To unhide
attrib -s -h filename
Running the below command in Powershell or the command prompt will unhide the file.
attrib -s -h EE54.tmp
Loading the file in PE-Bear, we can clearly see that there are more imports than we saw earlier, but this is still not a clean file for us to load it in IDA for further inspection because there are more things going on after this stage, but I won't cover this time because the objective of this post was to look at the Self-Injection part and we've accomplished that.
Conclusion & Takeaways
We look at two stages, firstly, the PE section overwrite, where we circumvented it and dumped the clean file to the disk from the buffer before it even had the chance to overwrite the sections. The second part is where the unpacked DLL was written to disk, and we grabbed the file from the path we found by debugging.
So next time you come across a PE file which is packed and you know it's running only one process, and no other processes are being spawned, then it's probably using the Self-Injection technique, and this is how you go about unpacking it.