TLDR
We try to prepare WebKit for research by building a debug version.
- 0x00: New Series: Getting Into Browser Exploitation
- 0x01: Setup and Debug JavaScriptCore / WebKit
- 0x02: The Butterfly of JSObject
- 0x03: Just-in-time Compiler in JavaScriptCore
- 0x04: WebKit RegExp Exploit addrof() walk-through
- 0x05: The fakeobj() Primitive: Turning an Address Leak into a Memory Corruption
- 0x06: Revisiting JavaScriptCore Internals: boxed vs. unboxed
- 0x07: Preparing for Stage 2 of a WebKit Exploit
- 0x08: Arbitrary Read and Write in WebKit Exploit
Introduction
Linus Henze, my CTF teammate, created the Webkit Exploit and he released the proof of concept code on GitHub. Our plan is to go through the exploit to understand everything, but that will take some time. So let's start by looking at the goal and run the exploit!
Execute the PoC
At the time of preparing the video, the bug was already fixed in the repository, but it wasn't shipped in Safari for macOS and iOS yet. In the repo the bug is described as following:
This is an optimization error in the way RegEx matching is handled. By setting lastIndex on a RegEx object to a JavaScript object which has the function toString defined, you can run code although the JIT thinks that RegEx matching is side effect free.
Exploitation is pretty similar to @5aelo's exploit for CVE-2018-4233, which can be found here.
Don't worry if you didn't understand the above description about the exploit, we'll learn about it in the future. Let's first run the exploit. The version of Safari I'm running is Version 12.0.1 (14606.2.104.1.1).
Before we can execute the exploit, we need to start a webserver, which serves our exploit to the browser. To do that we can simply run a PHP server as shown below:
php -S 127.0.0.1:1337
Additionally, for the exploit, we need to run a WebSocket server which is used to retrieve the output from the exploit.
const WebSocket = require('ws')

const ws = new WebSocket.Server({ port: 5000 });

wss.on('connection', function connection(ws) {
	ws.on('message', function incoming(message) {
    	console.log('received: %s', message);
    });
});
Let's run this script.
node websocket.js
Upon visiting http://127.0.0.1:1337, we see a link, and when visiting that site, the exploit is executed.
As you can see from the above image, the exploit process is pretty fast, and the output is shown in the browser as well as in the WebSocket server. Now, it's important to just glance over what the exploit process looks like, even though we don't understand it yet.
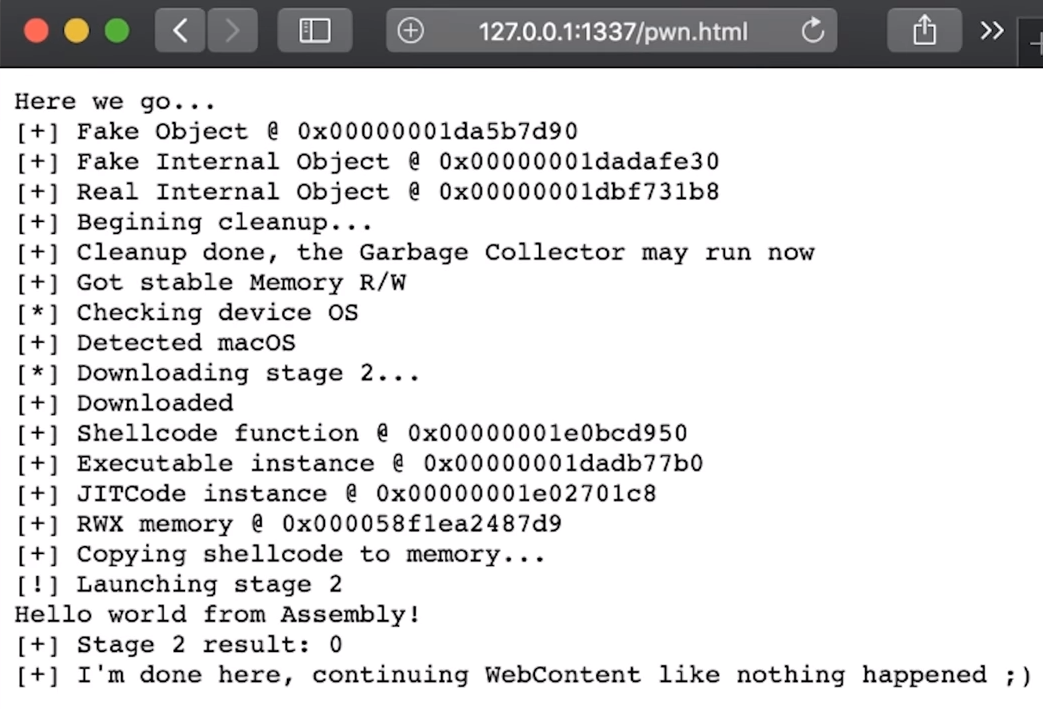
So, the exploit sets up some "Fake Objects", Cleans Some stuff up, Gets a "Read/Write primitive", Downloads the 2nd stage, Somehow gets access to "Read & Write Executable Memory", Copies the shellcode to that memory, and finally Executes the shellcode which prints "Hello world from Assembly", Awesome!
Getting the WebKit Source
As you already know WebKit is a web browser engine used in many products like Safari on macOS and iOS, Nintendo Switch and PlayStation. We can breakdown WebKit into mainly two different components.
- WebCore: Library responsible for HTML layout, rendering, and DOM.
- JavaScriptCore: Library which provides a JavaScript engine.
Before we can dive into the exploit, we need to setup an environment to test. So we could start by downloading the WebKit source from the website, but in the description of the exploit it says "Fixed in current WebKit release". So how can we get the vulnerable WebKit version?
In an attempt to find this version, I simply checked my Safari's User-Agent string. The version of WebKit my browser's User-Agent said was 605.1.15 and so I checked out the source code that matches this version from the code repository. Trying to build from the source was failing due to a weird error. And I noticed that the downloaded version of WebKit was already a year old - this didn't make any sense. And after researching a bit more, I found that WebKit decided to freeze the User-Agent for some of the reasons mentioned here. Either way, it was clearly not the correct version.
Then I asked Linus about this, and he told me the exact commit of WebKit from the GitHub repository that was still vulnerable. Now we can get the sources.
# Clone the WebKit repository from GitHub
git clone git://git.webkit.org/WebKit.git WebKit.git

# Check out a vulnerable version
git checkout 3af5ce129e6636350a887d01237a65c2fce77823
This commit was just before the vulnerability was fixed, so we can have a look at the following commit, which fixed the bug, in order to read the developer's description of the issue.
git log --reverse --ancestry-path 3af5ce129e6636350a887d01237a65c2fce77823..master
RegExp operations should not take fast path if lastIndex is no numeric.
Additionally, there was more info on this.
This is because if lastIndex is an object with a valueOf() method, it can execute arbitrary code which may have side effects, and side effects are not permitted by the RegExp fast paths.
Here, arbitrary code execution doesn't refer to some kind of shellcode, but instead it means that there could be arbitrary JavaScript code, which can lead to some side effects the execution engine didn't expect. Again, what exactly all this means, is a topic for another post.
Building WebKit
To build WebKit on macOS, we need XCode installed and have it correctly set up.
# Install
$ xcode-select --install
already installed...

# Make sure xcode path is properly set
$ xcode-select -p
/Applications/Xcode.app/Contents/Developer

# Confirm installation
$ xcodebuild -version
Xcode 10.1
Build version 10B61
Then we can execute the script which builds JSC (JavaScriptCore) as a debug build.
# Run the script which builds the WebKit
Tools/Scripts/build-webkit --jsc-only --debug

# jsc-only : JavaScriptCore only
# debug    : With debug symbols
The JavaScriptCore Runtime
After the completion of the build process, we can find the binary in the path ./WebKitBuild/Debug/bin/jsc. Executing the binary gives us a REPL (Read Eval Print Loop), which is basically a prompt that accepts input and interprets JavaScript - similar to NodeJs or the browser JS console.
Here's a quick little tip that I learned from Linus. There's a function called describe(), which can help to understand any object.
>>> describe(1)
Int32:1
Here, the Int32 represents the 32 bit integer type and the 1 is the value.
>>> describe(13.37)
Double: 4623716258932001341, 13.370000
Here, 4623716258932001341 is how the raw value of the double is represented in memory. We can easily decode this to 13.37 using python struct module.
>>> # This is Python Interpreter
>>> import struct
>>> # We pack the value with `Q` which means `unsigned long long`(64 bit Integer) and
>>> # then we unpack these raw bytes with `d`(double), hence we get back the value.
>>> struct.unpack("d", struct.pack("Q", 4623716258932001341))
(13.37,)
Getting back to the jsc interpreter. When trying to describe a string, we start seeing a bit more information.
>>> describe("string")
String (atomic) (identifier): string, StructureID: 4
Apparently strings have something called a StructureID - we will learn more about this later down the road. For now let's get crazy by describing an Array.
>>> describe([1, 2, 3])
Object: 0x1079b4340 with butterfly 0x10000e4010 (Structure 0x1079f2c30:[Array, {},
    CopyOnWriteArrayWithInt32, Proto:0x1079c80a0, Leaf]), StructureID: 102
So this array is an Object at the address 0x1079b4340 in memory and has so-called a butterfly at 0x10000e4010. The underlying array structure is set to CopyOnWriteArrayWithInt32 and it kinda makes sense because this is an array of integer values. Now let's try to change the values of this array by adding some floating point numbers.
>>> describe([1, 2, 3.456])
Object: 0x1079b4350 with butterfly 0x10000e4040 (Structure 0x1079f2ca0:[Array, {},
    CopyOnWriteArrayWithDouble, Proto:0x1079c80a0, Leaf]), StructureID: 103
As you can see, this changes the Array to CopyOnWriteArrayWithDouble. This means the integer was also converted into a Double. Now, what happens if we were to add a string to this list.
>>> describe([1, 2, 3.456, "78"])
Object: 0x1079b4360 with butterfly 0x10000e4070 (Structure 0x1079f2d10:[Array, {},
    CopyOnWriteArrayWithContiguous, Proto:0x1079c80a0, Leaf]), StructureID: 104
Now this array becomes more generic due to the fact that it holds values of different types. If we play around a bit more, like adding an array inside an array, we see another small change.
>>> describe([{}, 1, 13.37, [1, 2, 3], "test"])
Object: 0x1079b4380 with butterfly 0x10000e0008 (Structure 0x1079f2ae0:[Array, {},
    ArrayWithContiguous, Proto:0x1079c80a0, Leaf]), StructureID: 99
Now we have only ArrayWithContiguous, it's not a "Copy On Write" array anymore. You can see this is already very useful to learn more about the internals of WebKit.
Setting up lldb
Let's try setting up a lldb - lldb is a debugger similar to gdb. We can use lldb to debug jsc.
# Incase of a python error, run the following
$ alias lldb='PATH="/usr/bin:$PATH" lldb'

# Load the file to the  debugger
$ lldb ./WebKitBuild/Debug/bin/jsc
(lldb) target create "./WebKitBuild/Debug/bin/jsc"
Current executable set to './WebKitBuild/Debug/bin/jsc' (x86_64).
(lldb) run
Process 4233 launched: './WebKitBuild/Debug/bin/jsc' (x86_64)
>>>
Back to messing around with JSC
Now that we have the debugger attached to the jsc interpreter, let's create an array and dig deeper.
>>> a = [1, 2, 3, 4]
1,2,3,4
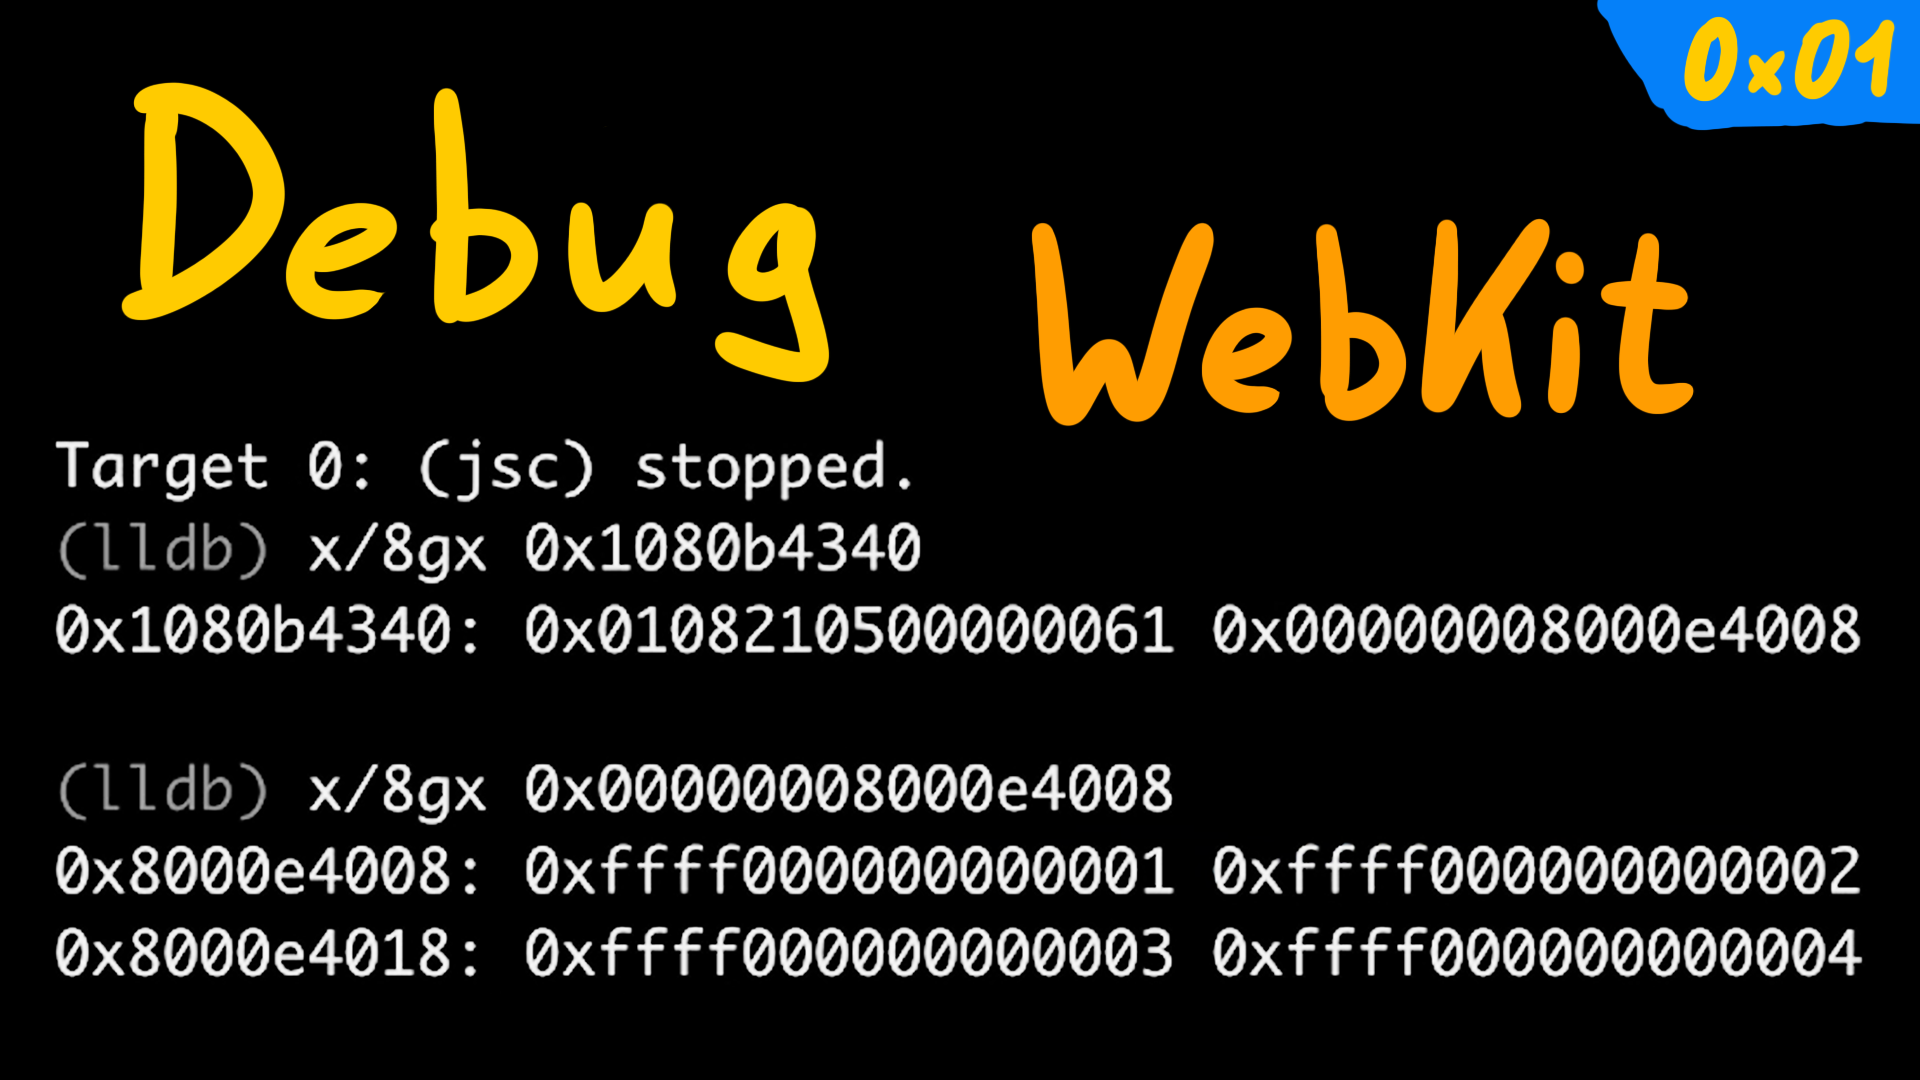
>>> describe(a)
Object: 0x1080b4340 with butterfly 0x8000e4008 (Structure 0x1080f2a00:[Array, {},
ArrayWithInt32, Proto:0x1080c80a0, Leaf]), StructureID: 97
The object is at the address 0x1080b4340 and the butterfly is at 0x8000e4008. Let's hit Ctrl+C to break out of the JavaScript interpreter into lldb. lldb's commands are sometimes different from gdb's commands, but to examine the memory it's pretty much the same.
(lldb) x/8gx 0x1080b4340
0x1080b4340: 0x0108210500000061 0x00000008000e4008
0x1080b4350: 0x00000000badbeef0 0x00000000badbeef0
0x1080b4360: 0x00000000badbeef0 0x00000000badbeef0
0x1080b4370: 0x00000000badbeef0 0x00000000badbeef0
Here, the second value 0x00000008000e4008 looks like the butterfly address, so let's examine that.
(lldb) x/8gx 0x00000008000e4008
0x8000e4008: 0xffff000000000001 0xffff000000000002
0x8000e4018: 0xffff000000000003 0xffff000000000004
0x8000e4028: 0x00000000badbeef0 0x00000000badbeef0
0x8000e4038: 0x00000000badbeef0 0x00000000badbeef0
If we look closely, we can find some numbers which look like the values of the array [1, 2, 3, 4].
However, the weird thing is that the high bytes of these values are set to ffff; what this means we will learn later.
Now let's try one other thing - breakpoints. You can set a breakpoint using b command. Since we have the debug symbols, we can easily find functions by name using tab completion.
As you can see, we've listed some of the Math functions. If you want to look for a specific function, you can also try to search the function in the source code base and get the proper C++ function name. Just to play around, let's set a breakpoint to the Math.Max function.
(lldb) b JSC::mathProtoFuncMax(JSC::ExecState*)
Breakpoint 1: where = JavaScriptCode`JSC::mathProtoFuncMax(JSC::ExecState*) + 15
at MathObject.cpp:227, address = 0x000000010164ffff
(lldb) c
Once the breakpoint is placed, we can get back to the JavaScript interpreter by using the c command, which stands for continue execution. Now if we try to execute Math.max(13.37), we hit the breakpoint, and we even see the source code of the function!
>>> Math.max(13.37)
Process 4122 stopped
* thread #1, queue = 'com.apple.main-thread', stop reason = breakpoint 1.1
    frame #0: 0x000000010164ffff JavaScriptCode`JSC::mathProtoFuncMax(exec=0x00007ffeefbfd1e0)
    at MathObject.cpp:227
    224
    225  EncodedJSValue JSC_HOST_CALL mathProtoFuncMax(ExecState* exec)
    226  {
 -> 227       VM& vm = exec->vm();
    228       auto scope = DECLATE_THROW_SCOPE(vm);
    229       unsigned argsCount = exec->argumentCount();
    230       double result = -std::numeric_limits<double>::infinity();
Target 0: (jsc) stopped.
We can also step through the code using n and print some values using p, to see how the function works.
This is exactly how I always wanted to debug and learn about browser exploitation.